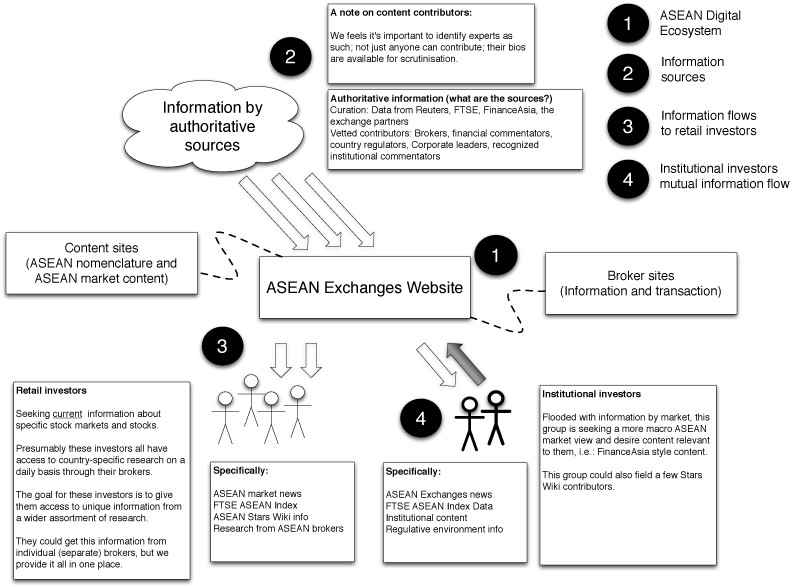
It’s a bit nerdy; but I love creating these little ecosystem diagrams in order to help my clients understand where all the elements fit in relation to each other – players, processes, methods.
Here’s one that I drew up for the ASEAN Exchanges website.

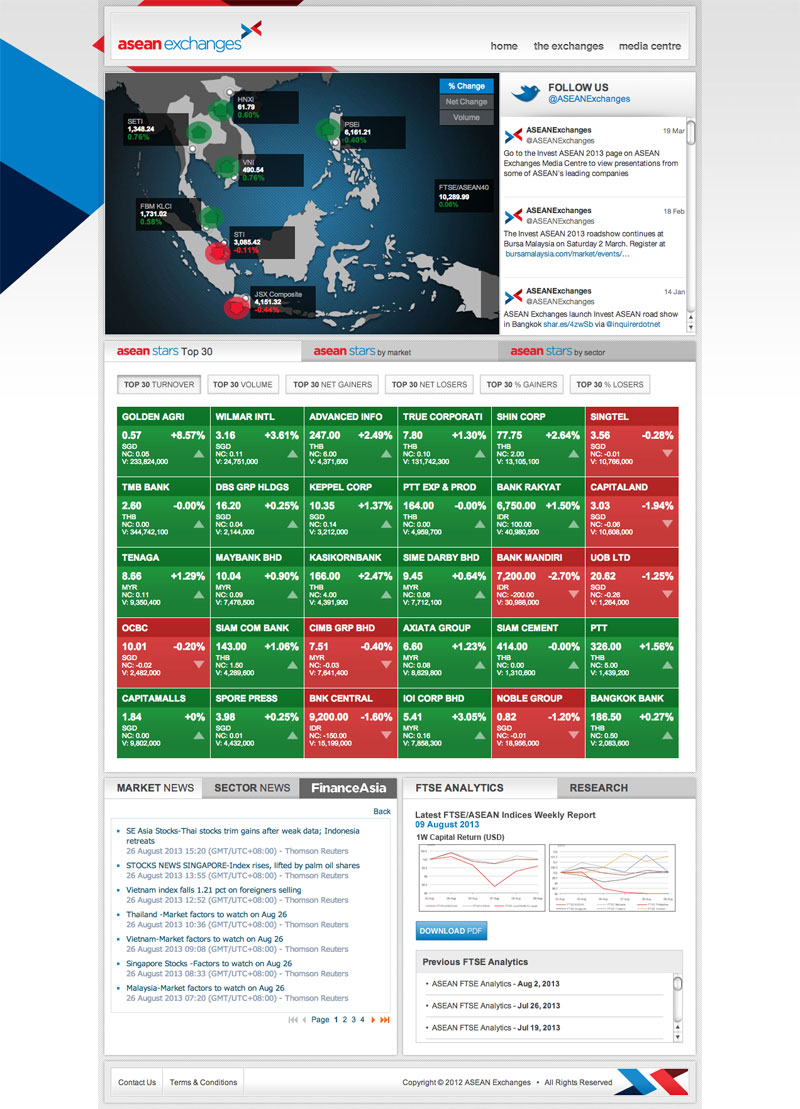
The role of this website is to visualise financial data from the 7 member exchanges around ASEAN. To do this, the site sucks in several feeds from Thompson Reuters and parses it for human consumption.
